Andrews Real Estate
  • About Us
    • Brad & Barb Andrews
    • Testimonials
    • Keller Williams Jackson Hole
  • Property Search
    • Featured Properties
    • Jackson Hole, Wyoming
    • Teton Valley, Idaho
    • New to the Market
    • Search Properties
  • Area Guide
  • Buyers
    • For Buyers
    • Market Report
    • Buyer’s Guide
    • Wyoming Tax Benefits
    • Area Map
  • Sellers
  • Contact
  • Menu Menu
  • Facebook

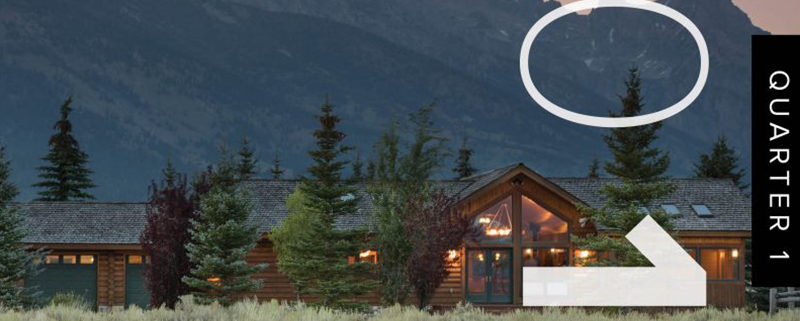
Jackson Hole Real Estate Market Report | 2018 Quarter 1

On behalf of our team of dedicated professionals at Jackson Hole Real Estate Associates, we are pleased to present our comprehensive market report for 2018 quarter 1. In this detailed report, you will find information on the market segments making up the Jackson Hole area. As the market leader in Jackson Hole, we have developed a more dynamic report that sheds fresh light on the insights and trends that are shaping our real estate market.

While the total dollar volume in quarter 1 of 2018 was almost the same as 2017, number of transactions increased significantly, up 22%. Average sale price decreased by 36%, this figure was skewed by a large transaction in 2017. The median sale price decreased by 11% and was a function of the type of property transactions that took place in the beginning of 2018. Nearly 60% of the transactions in quarter 1 were in the under $1 million price segment, a 40% increase when compared to the same period last year. New inventory remained very low driving average days on market down, decreased 15%.
https://www.andrews2realestate.com/wp-content/uploads/2018/04/JH2018Quarter1Square.jpg 800 800 Andrews2 Real Estate https://www.andrews2realestate.com/wp-content/uploads/2021/09/Andrews2RE_Horiz_Black.png Andrews2 Real Estate2018-04-19 10:15:182018-04-19 10:15:18Jackson Hole Real Estate Market Report | 2018 Quarter 1

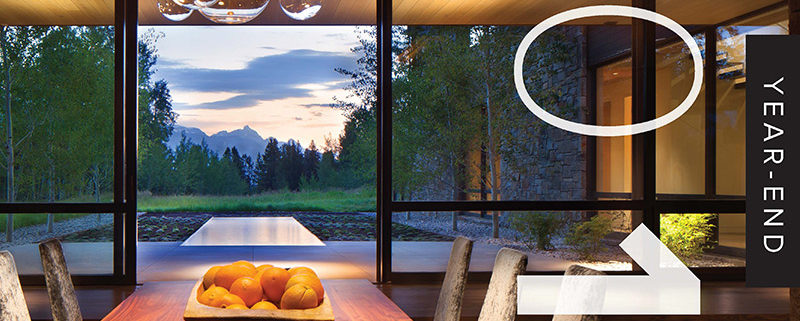
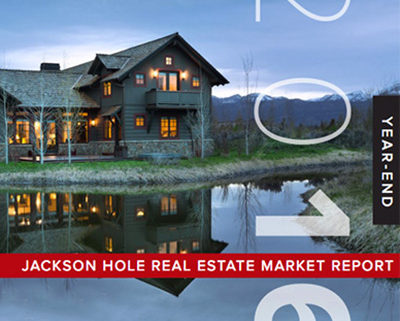
Jackson Hole Real Estate Market Report | Year End 2017

On behalf of our team of dedicated professionals at Jackson Hole Real Estate Associates, we are pleased to present our comprehensive market report for 2017 year-end. In this detailed report, you will find information on the market segments making up the Jackson Hole area. As the market leader in Jackson Hole, we have developed a more dynamic report that sheds fresh light on the insights and trends that are shaping our real estate market.

Persistent demand and lean supply drove prices upward in 2017. Even though the number of transactions remained steady, average and median sale prices increased by 15% and 3%, respectively. The south of Jackson area received the largest increase in the number of transactions, up nearly 60% compared to last year. This is primarily due to the success of the Snake River Sporting Club development, which had 26 transactions in 2017. Properties in the $500,000- $1 million price range were the most popular representing about 37% of total transactions. Active listings declined 23% compared to last year which caused an even more competitive environment for buyers. With 50 properties under contract at 2017 year-end, the start to the new year is expected to follow much of the same pattern of 2017.

https://www.andrews2realestate.com/wp-content/uploads/2018/01/JH-2017-Market-Report-_YearEndSquare.jpg 800 800 Andrews2 Real Estate https://www.andrews2realestate.com/wp-content/uploads/2021/09/Andrews2RE_Horiz_Black.png Andrews2 Real Estate2018-01-22 13:48:582018-01-22 13:50:31Jackson Hole Real Estate Market Report | Year End 2017

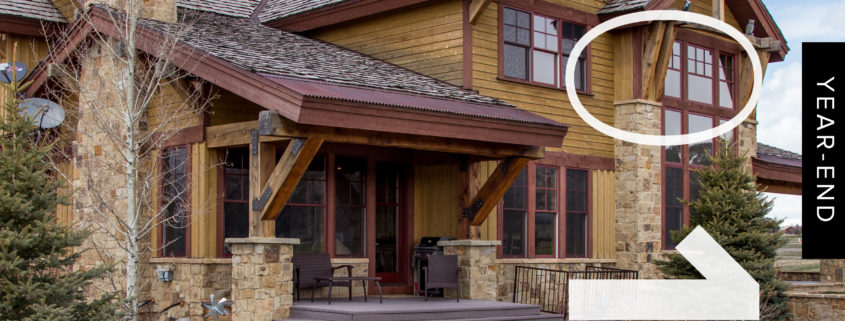
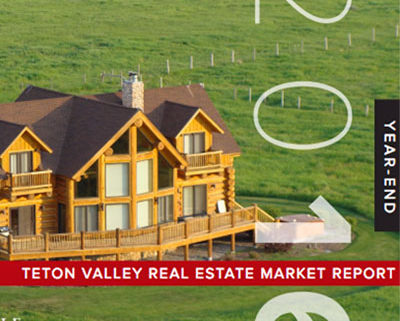
Teton Valley Real Estate Market Report | Year End 2017

On behalf of our team of dedicated professionals at Jackson Hole Real Estate Associates, we are pleased to present our comprehensive market report for 2017 year-end. In this detailed report, you will find information on the market segments making up the Teton Valley area including Alta, Wyoming. As the market leader, we have developed a more dynamic report that sheds fresh light on the insights and trends that are shaping our real estate market.

Demand for real estate in Teton Valley, Idaho remained strong. The overall market in 2017 experienced an increase in the number of transactions, up about 5% when compared to 2016. The total dollar volume increased 16%, from 105,584,519 to 122,409,008 in 2017. The average and median sale prices increased as well. Alta, Wyoming market was strong as well with increases in all segments. Particularly, the single family segment with substantial increases in total dollar volume, transactions, average sale price and median sale price.

https://www.andrews2realestate.com/wp-content/uploads/2018/01/TV-17-YearEnd-Social-Media-Image.jpg 2500 2500 Andrews2 Real Estate https://www.andrews2realestate.com/wp-content/uploads/2021/09/Andrews2RE_Horiz_Black.png Andrews2 Real Estate2018-01-22 11:52:542018-01-22 13:53:52Teton Valley Real Estate Market Report | Year End 2017

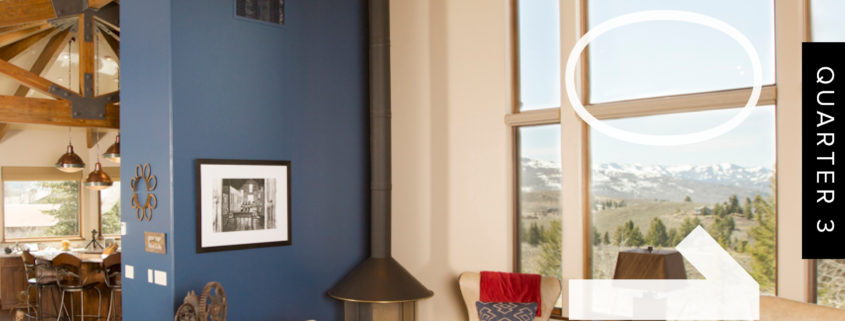
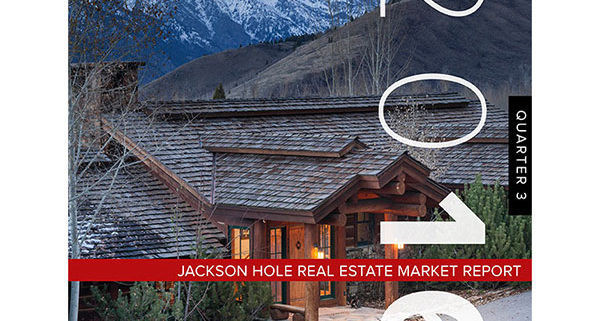
Jackson Hole Real Estate Market Report | 2017 Quarter 3

On behalf of our team of dedicated professionals at Jackson Hole Real Estate Associates, we are pleased to present our comprehensive market report for the third quarter of 2017. In this detailed report, you will find information on the market segments making up the Jackson Hole area. As the market leader in Jackson Hole, we have developed a more dynamic report that sheds fresh light on the insights and trends that are shaping our real estate market.When comparing the first three quarters of 2017 to the same period in 2016, the Jackson Hole real estate market remained steadfast. With inventory in short supply (down 11%), the number of transactions kept pace with last year. Nonetheless, demand for property in Jackson Hole remained very strong, which contributed to the increase in average sale price. The price segment with the most market share was the $500,000 – $1 million price segment with 37% of total transactions. The Town of Jackson had a 7% increase in transactions. The area furthest south of Jackson experienced the largest increase in transactions, up about 50% over last year. Approximately 43% of the transactions this year were cash transactions.

The overall market continued to experience a lack of inventory, down 11%. New, realistically-priced properties sold the quickest. In fact, the average number of days a property was on the market dropped 28% when compared to a year ago. View full report by clicking here.

https://www.andrews2realestate.com/wp-content/uploads/2017/11/JH-Q3-Market-Report-Instagram-Image.jpg 2500 2500 Andrews2 Real Estate https://www.andrews2realestate.com/wp-content/uploads/2021/09/Andrews2RE_Horiz_Black.png Andrews2 Real Estate2017-11-27 10:00:502017-11-27 10:03:23Jackson Hole Real Estate Market Report | 2017 Quarter 3

Jackson Hole Real Estate Market Report | 2017 Quarter 1

On behalf of our team of dedicated professionals at Jackson Hole Real Estate Associates, we are pleased to present our comprehensive market report for the first quarter of 2017. In this detailed report, you will find information on the market segments making up the Jackson Hole area. As the market leader in Jackson Hole, we have developed a more dynamic report that sheds fresh light on the insights and trends that are shaping our real estate market.

The Jackson Hole real estate market remained strong at the start of the new year. The overall number of transactions increased about 14% and total dollar volume increased 20% when compared to the first quarter of 2016.

The Jackson Hole real estate market remained strong at the start of the new year. The overall number of transactions increased about 14% when compared to the first quarter of 2016. The vast majority of transactions took place in the $500,000-$1 million price segment. This was a change from the first quarter of 2016 when transactions were more evenly distributed between the $500,000-$2 million price segment. This change can be attributed to an increase in vacant land transactions, up about 50%. Inventory remained at historical lows, down about 13% when compared to the first quarter of last year.

The number of active listings decreased, down about 13%, and the number of listings under contract decreased about 7% when compared to the first quarter of 2016.

https://www.andrews2realestate.com/wp-content/uploads/2017/04/400x400JH-Q1-Market-Report-Facebook-Post-Image-1024x536-1-1.jpg 400 400 Andrews2 Real Estate https://www.andrews2realestate.com/wp-content/uploads/2021/09/Andrews2RE_Horiz_Black.png Andrews2 Real Estate2017-04-17 16:04:052017-04-17 16:10:07Jackson Hole Real Estate Market Report | 2017 Quarter 1

Teton Valley Market Report | Year End

On behalf of our team of dedicated professionals at Jackson Hole Real Estate Associates, we are pleased to present our comprehensive market report for the 2016 year-end. In this detailed report, you will find information on the market segments making up the Teton Valley area. As the market leader in the Jackson Hole area, we have developed a more dynamic report that sheds fresh light on the insights and trends that are shaping our real estate market.

https://www.andrews2realestate.com/wp-content/uploads/2017/03/TVmktRpt.jpg 400 400 Andrews2 Real Estate https://www.andrews2realestate.com/wp-content/uploads/2021/09/Andrews2RE_Horiz_Black.png Andrews2 Real Estate2017-03-01 10:28:572017-03-01 10:36:45Teton Valley Market Report | Year End

Jackson Hole Market Report | Year End

On behalf of our team of dedicated professionals at Jackson Hole Real Estate Associates, we are pleased to present our comprehensive market report for the 2016 year-end. In this detailed report, you will find information on the market segments making up the Jackson Hole area. As the market leader in Jackson Hole, we have developed a more dynamic report that sheds fresh light on the insights and trends that are shaping our real estate market.

https://www.andrews2realestate.com/wp-content/uploads/2017/03/MarketReportcropped.jpg 400 400 Andrews2 Real Estate https://www.andrews2realestate.com/wp-content/uploads/2021/09/Andrews2RE_Horiz_Black.png Andrews2 Real Estate2017-01-01 10:25:282017-03-01 10:30:01Jackson Hole Market Report | Year End

Jackson Hole Market Report | Quarter 3

The Jackson Hole real estate market through the third quarter of this year continued the trends seen earlier in the year with a decrease in the number of transactions, down about 10%, compared to the third quarter of 2015. While the number of transactions were down, the average and median sale prices continued to rise with a 3% and 6% gain respectively. The majority of transactions, about 37%, took place in the $500,000-$1,000,000 price range. Single family home transactions had the most growth this year, consisting of about 40% of all the transactions through the third quarter. This represented an approximate 16% increase compared to this time last year when the condominium/townhome segment was more prevalent.

https://www.andrews2realestate.com/wp-content/uploads/2016/10/JHREACover.jpg 464 600 Andrews2 Real Estate https://www.andrews2realestate.com/wp-content/uploads/2021/09/Andrews2RE_Horiz_Black.png Andrews2 Real Estate2016-10-18 11:26:412017-03-01 10:46:53Jackson Hole Market Report | Quarter 3

Jackson Hole Real Estate Market Report | 2016 Quarter 2

The overall market in the first half of 2016 experienced a decrease in the number of transactions, down about 14% compared to the first half of 2015. While the number of transactions fell, the average and median sale prices were still higher in the first half of 2016 than in the first half of 2015. The average sale price increased by about 9% and the median sale price increased about 10%. The average and median sale prices were higher than in 2015, but lower than in the first quarter of 2016. The difference may be attributed to the shift in the distribution of sales in the $500,000-$1 million price range, 39% of total sales. There were 78 transactions under $1 million. Properties also sold more quickly than in the first half of 2015. The average number of days on market decreased by 12%, and by over 18% in the single family and vacant land segments.

The inventory shortage throughout 2015 did not change much in the first half of 2016, with the number of active listings up only 1%. Without a large increase in inventory, low supply will likely continue to be a contributing factor in the balance of 2016.

https://www.andrews2realestate.com/wp-content/uploads/2016/07/Q2-JH-Market-Report-cover-image.jpg 464 600 Andrews2 Real Estate https://www.andrews2realestate.com/wp-content/uploads/2021/09/Andrews2RE_Horiz_Black.png Andrews2 Real Estate2016-07-15 13:12:492016-10-18 11:38:01Jackson Hole Real Estate Market Report | 2016 Quarter 2

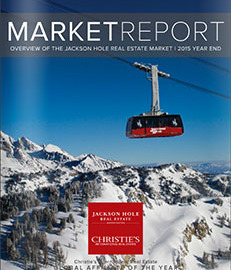
2015 Year End Market Report

View Year End Market Report

https://www.andrews2realestate.com/wp-content/uploads/2016/01/Market-Report.jpg 284 231 Andrews2 Real Estate https://www.andrews2realestate.com/wp-content/uploads/2021/09/Andrews2RE_Horiz_Black.png Andrews2 Real Estate2016-01-19 14:37:272016-10-18 11:39:332015 Year End Market Report
Page 2 of 3123

Quick Search

Map Search | Advanced Search

How can we help?

Barb Andrews
(307) 413-6620
Barb@Andrews2.com

Brad Andrews
(307) 413-5846
Brad@Andrews2.com

We look forward to helping you with all your real estate needs!

Brad Andrews
Responsible Broker

Brad@Andrews2.com
(307) 413-5846

Barbara Andrews
Associate Broker

Barb@Andrews2.com
(307) 413-6620

© 2025 Copyright – Andrews Real Estate

Scroll to top